


Every three years, the Programme for International Student Assessment (PISA) gives us a snapshot of what 15-year-olds around the world fare in reading, science and mathematics. The latest results, released on 8 September 2026, offer some striking clues. East Asian education systems once again feature prominently among the world’s highest performers, with science taking centre stage as the main domain. 1
In this article, we’ll explore the top 10 performers in each domain and see where the UK stands in relation to the OECD average.


Who leads the latest PISA rankings?
The OECD released the latest PISA results on 8 September 2026.
-🇨🇳 B-S-J-Z (China)—the OECD shorthand for Beijing, Shanghai, Jiangsu and Zhejiang—recorded the highest scores in science (597) and mathematics (612)
-🇸🇬 Singapore recorded the highest score in reading (535).
-🇬🇧 The UK ranked among the top 10 education systems in all three core domains, scoring 511 in science, 488 in mathematics, and 494 in reading.
What is PISA, and how are scores calculated?
Before we dive in, here's a breakdown of the numbers from the largest PISA cycle so far.
PISA 2025
PISA 2025
The PISA framework and test cycle
The Programme for International Student Assessment (PISA) is an Organisation for Economic Co-operation and Development (OECD) international assessment that assesses 15-year-old students every three or four years in reading, mathematics, and science, with one domain designated as the major focus each cycle (science in 2025).

PISA 2025 introduced an innovative domain, Learning in the Digital World, which includes the assessment of computational problem solving. 2
PISA scoring in plain English
The PISA scores are scaled so the OECD average is around 500, with a standard deviation of about 100.
PISA reports the average performance of students in each country or economy, using statistical estimates that account for uncertainty in the test results. 3

Here's how the scores are made:
| Step | What happens | Why it matters |
|---|---|---|
| 1. Select schools and students | PISA randomly picks a sample of schools, then a sample of 15‑year‑olds in each school. | This gives a fair picture of all 15‑year‑olds without testing everyone. |
| 2. Apply student weights | Each student gets a “weight” so the sample matches the country’s full 15‑year‑old population. | Without weights, some groups would be over‑ or under‑represented. |
| 3. Turn answers into ability scores | Using statistical models (IRT), PISA converts test answers and background info into 10 “plausible values” per student per subject. | This accounts for the fact that students only answer part of the test and we can’t know their exact ability. |
| 4. Calculate country averages | Analysts run the analysis 10 times (once per plausible value), average the results, and use replicate weights to estimate uncertainty. | This produces the final mean score (e.g. maths = 494) and tells us how precise it is. |
| 5. Report by domain, not “overall” | Separate scores are published for reading, mathematics and science; there is no official combined “overall” score. | Each subject measures different skills, and combining them would oversimplify the results. |
Reading the tables correctly
Here are some pointers for reading PISA score tables and interpreting the results accurately.
PISA 2025 results at a glance
The results published on 8 September 2026 (OECD PISA 2025 Volume I) cover science, mathematics, reading and computational problem solving. 4
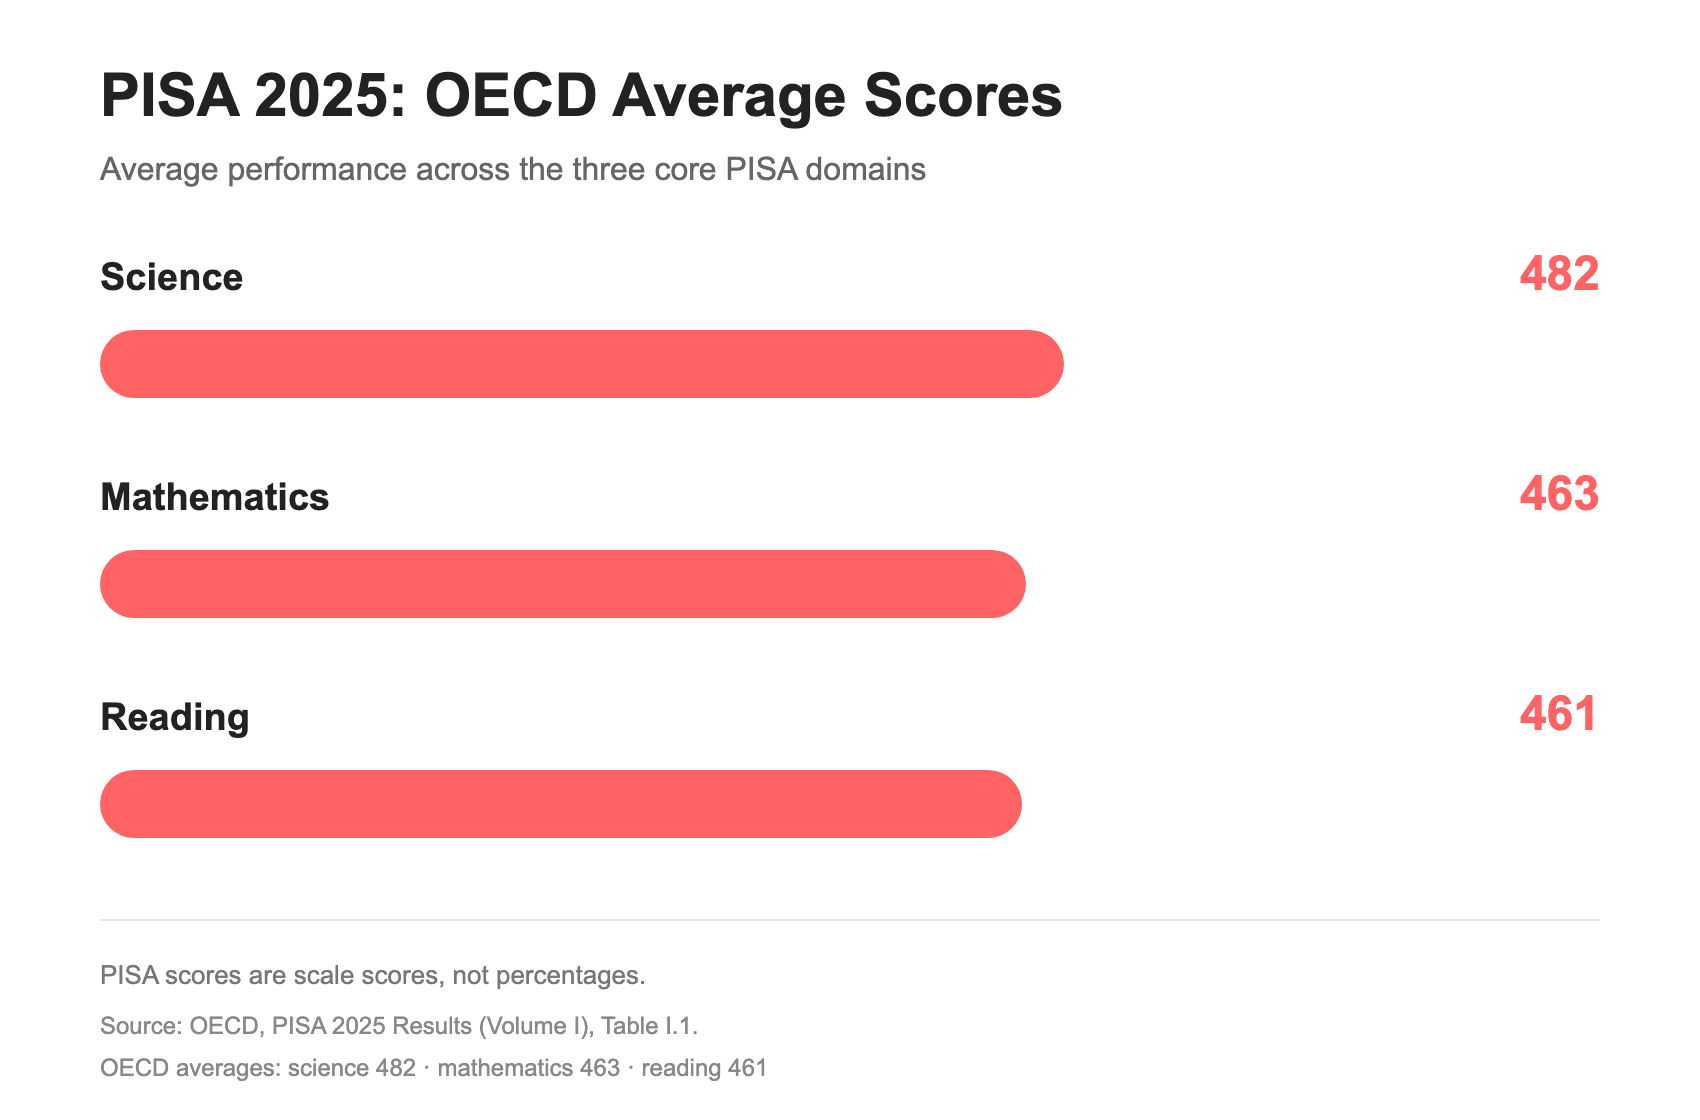
At a glance, the OECD average score showed a steep decline for the mathematics and reading domains.
Further PISA 2025 reports on English as a foreign language and self‑regulated learning in the digital world are scheduled for release in 2027.
Science – Top 10 Countries
First, let’s begin by looking at the top 10 countries and economies in science, PISA 2025’s major domain.
| Rank | Economy / Country | Mean Science Score |
|---|---|---|
| 1 | B-S-J-Z (China) | 597 |
| 2 | Singapore | 560 |
| 3 | Macao (China) | 541 |
| 4 | Chinese Taipei | 540 |
| 5 | Japan | 538 |
| 6 | Estonia | 527 |
| 7 | Korea | 522 |
| 8 | United Kingdom | 511 |
| 9 | Canada | 510 |
| 10 = | New Zealand | 509 |
| 10 = | Australia | 509 |
The UK recorded 511 points, compared with an OECD average of 482. Science was also the domain in which the UK recorded its clearest recent improvement: its mean score increased by 12 points between 2022 and 2025.
Mathematics – Top 10 Countries
Next, let's review the PISA assessment scores by country and economy for the mathematics domain.
| Rank | Economy / Country | Mathematics Mean Score |
|---|---|---|
| 1 | B-S-J-Z (China) | 612 |
| 2 | Singapore | 563 |
| 3 | Macao (China) | 549 |
| 4 | Chinese Taipei | 546 |
| 5 | Japan | 525 |
| 6 | Korea | 522 |
| 7 | Estonia | 508 |
| 8 | Switzerland | 499 |
| 9 | United Kingdom | 488 |
| 10 | Canada | 485 |
Across OECD countries, average maths scores fell to their lowest-ever level in PISA 2025, dropping by about 22 points since the previous cycle. The UK scored 488 points, compared with an OECD average of 469.
Reading – Top 10 Countries
Last but not least, let's review the PISA scores by country and economy for the reading domain.
| Rank | Economy / Country | Reading Mean Score |
|---|---|---|
| 1 | Singapore | 535 |
| 2 | B-S-J-Z (China) | 527 |
| 3 | Chinese Taipei | 508 |
| 4 | Japan | 503 |
| 5 | Macao (China) | 501 |
| 6 | Korea | 501 |
| 7 | Ireland | 500 |
| 8 | Estonia | 499 |
| 9 | New Zealand | 497 |
| 10 | United Kingdom | 494 |
Reading saw some of the steepest global declines, with OECD average reading falling from 476 (2022) to 461 (2025). The UK’s reading performance was stable to slightly up, helping it move into the top 10 in international rankings. 5

OECD Official Country Tables
For the complete, official list of mean scores in science, mathematics and reading for all 91 participating countries and economies, go to the OECD’s PISA 2025 Results (Volume I) report and open the section “Results for countries and economies”.
Interpreting PISA without the pitfalls
When it comes to interpreting PISA scores 7, you might want to remember these few points:
PISA looks at how well 15-year-olds can use reading, maths and science in real-life situations, not simply how much of the school curriculum they can remember.
A difference of only a few PISA points may not be statistically meaningful. It is safer to look at longer-term trends than small changes in rank from one assessment to the next.
OECD uses about 20 PISA points as a rough benchmark for the learning that a typical 15-year-old gains in one year. It helps show the scale of a difference, but should not be treated as a literal conversion into years of schooling.
What PISA tells us about world education rankings
Over the years of different PISA cycles and the participation of different countries, here are some key takeaways that we can uncover about the significance of this global performance data and world ranking.
The strongest systems combine high scores with smaller gaps between students from richer and poorer backgrounds.
PISA results have fallen since 2018, with OECD averages in reading and mathematics now at their lowest levels recorded.
PISA tests how well students can use what they know in reading, mathematics and science — not simply how much content they can remember.
We hope you have enjoyed learning about the latest PISA scores by country. Let's hope for the best for the UK, with consistent growth for all three domains in the next PISA cycle!
References
- Stavridou, Yiota. “Asia Dominates Global Education: A Historic Decline for the West.” Neos Kosmos, 17 Sept. 2026, https://neoskosmos.com/en/2026/09/17/dialogue/opinion/asia-dominates-global-education-a-historic-decline-for-the-west/. Accessed 7 Oct. 2026.
- Organisation for Economic Co-operation and Development. “PISA 2025 Learning in the Digital World.” OECD, 2024, https://www.oecd.org/en/topics/sub-issues/learning-in-the-digital-world/pisa-2025-learning-in-the-digital-world.html. Accessed 7 Oct. 2026.
- Organisation for Economic Co-operation and Development. “PISA Research Documentation: How to Prepare and Analyse the PISA Database.” OECD, 2024, https://www.oecd.org/en/about/programmes/pisa/how-to-prepare-and-analyse-the-pisa-database.html. Accessed 7 Oct. 2026.
- Organisation for Economic Co-operation and Development. PISA 2025 Results (Volume I). OECD Publishing, 2026, https://doi.org/10.1787/73451bc5-en.
- Grenier, E. “PISA 2025 Results: Reading and Math Scores Plummet Worldwide.” Deutsche Welle, 8 Sept. 2026, https://www.dw.com/en/pisa-2026-results-reading-math-scores/a-79147293. Accessed 7 Oct. 2026.
- Organisation for Economic Co-operation and Development. PISA 2025 Results (Volume I)—Country Notes: United Kingdom. 2026, https://www.oecd.org/content/dam/oecd/en/publications/reports/2026/09/pisa-2025-results-volume-i-country-notes_88d1164e/united-kingdom_044541d1/9e46f2f7-en.pdf. Accessed 7 Oct. 2026.
- Schleicher, Andreas, and Organisation for Economic Co-operation and Development. PISA 2022: Insights and Interpretations. OECD, 2023, https://www.oecd.org/content/dam/oecd/en/publications/support-materials/2023/12/pisa-2022-results-volume-i_76772a36/PISA%202022%20Insights%20and%20Interpretations.pdf. Accessed 7 Oct. 2026.
Summarise with AI:
Did you like this article? Leave a rating!

 Loading...